The VVV Survey
The VVV Survey covers ~ 528 deg² containing ∼10^9 point sources and it includes multi-wavelength (ZYJHKs) coverage of the area as well as time monitoring in Ks band. The survey is scheduled to collect over 2000 hours of execution time.
The VISTA Telescope tile field of view is 1.501 deg², hence 196 tiles are needed to map the bulge area and 152 tiles for the disk. Adding some X and Y overlap between tiles for a smooth match, the area of our unit tile covered twice is 1.458 deg².
The VVV bulge area covers −10º < l < +10º and −10º < b < +5º, where the survey will give the most complete catalogue of variable objects in the bulge, with more than ∼10^6 variables. Chief among them are the RR Lyrae, which are accurate primary distance indicators, and well understood regarding their chemical, pulsational and evolutionary properties. Our survey of the RR Lyrae in the Galactic bulge will allow us to map its 3-D structure (as shown by Carney et al., 1995) and will provide key information on the age of its population, given that RR Lyrae stars are tracers of the old population (e.g., Catelan, 2004b, 2009, …).

In order to understand the Milky Way’s populations globally, it is necessary to survey the inner Galactic plane as well. Therefore, we will survey an adjacent region of the mid-plane and provide a Legacy Database and 3-D atlas of a large Population I (i.e. young and luminous stars) region. We have selected the region −65º < l < −10º and |b| < 2º, where star-formation activity is high and for which there will be complementary optical, mid-IR, and far-IR data from VPHAS+, the Spitzer, GLIMPSE and MIPSGAL surveys, and from the all- sky AKARI and WISE survey.
The Ks- band observations
The variability study in the bulge will be carried out in the Ks band down to ∼18 mag (signal-to-noise ≈ 3). The total exposure time for a VISTA tile field is 162 s. Our strategy yields about 30 deg² per hour, or 300 deg² per night. The combined epochs will reach Ks = 20 mag, which is three magnitudes fainter than the de-reddened bulge main-sequence turn-off (MS turn-off), although the densest fields will be confusion-limited. However, applying both PSF fitting and image subtraction, we will recover the light curves of most objects down to Ks = 18 mag, even in moderately crowded fields. This is more than 3 mag fainter than the de-reddened known RR Lyrae in the Galactic bulge. We expect to find RR Lyrae even in fields with AV = 10 mag.
If you are interested in the distribution of the individual Ks-band epochs, have a look at the next two plots.
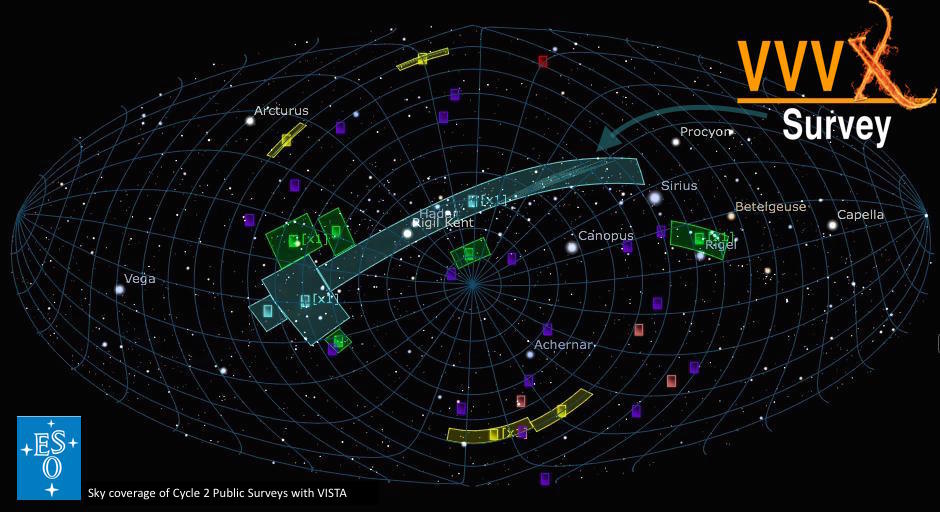
The VVV eXtension: VVVX
The observations for VVVX commenced on June 30, 2016, and will continue until 2022.
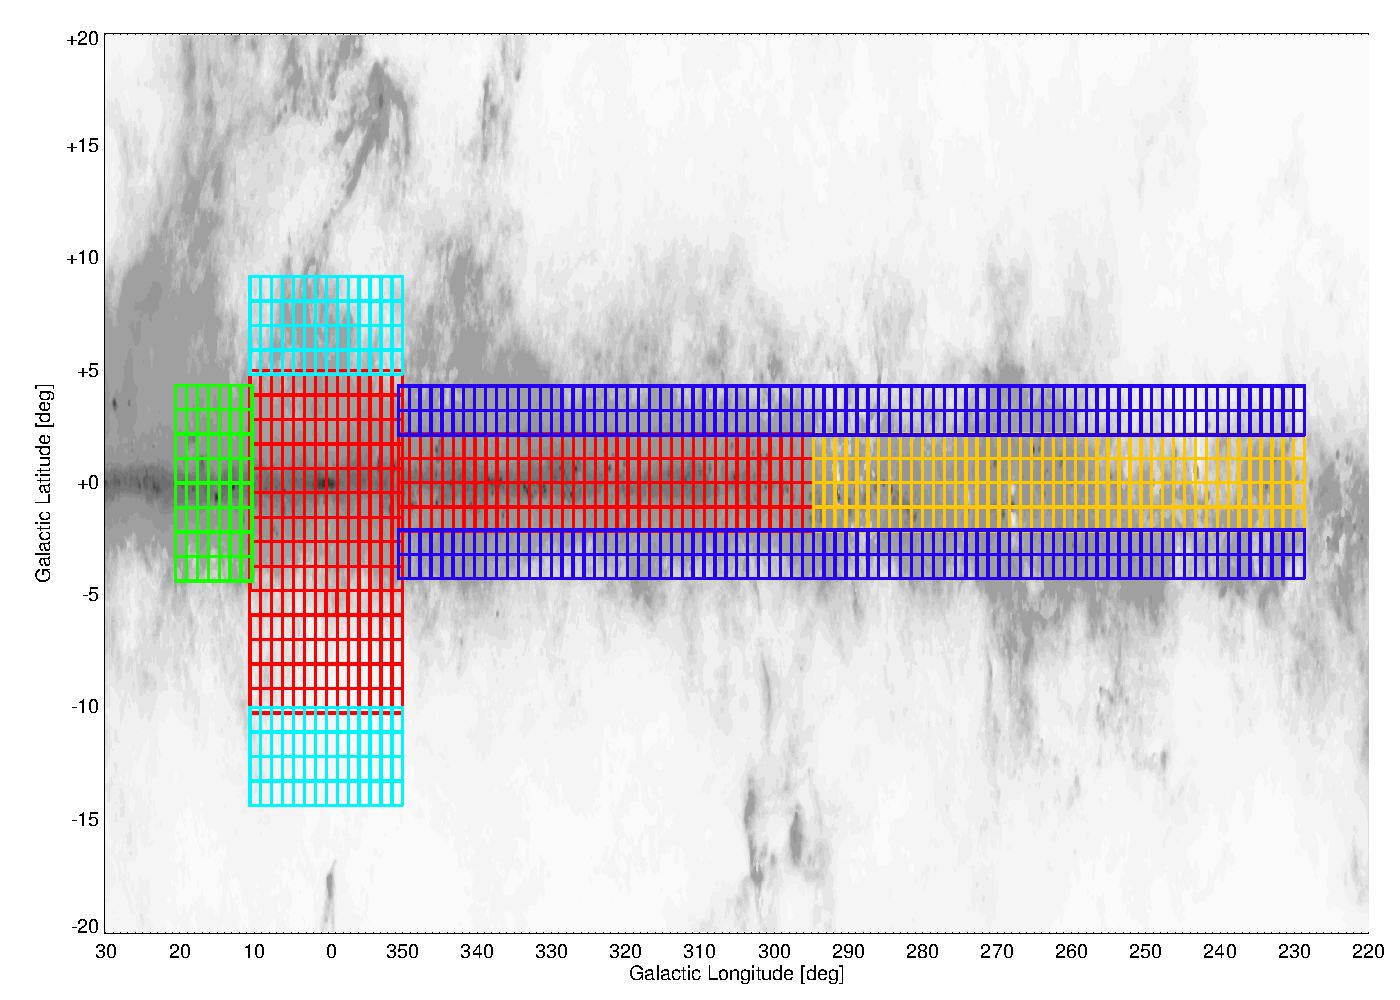
VVVX was granted a total of 2000 hours observing time, covers a total of ~1700 sqr. degrees on sky and consists now of 1028 individual VIRCAM tiles. In contrast to VVV the additional areas will be observed in J, H and Ks only. The color coded areas shown in the figure below are:
I. Red: the original VVV area, for which we will obtain between 3 to 10 additional Ks-band observations, one to three per year, to extend the time line for PM studies.
II. Cyan: High/Low Bulge, extending the original bulge area to latitude +9.5º and -14.5º.
III. Green: Disk+20: extending the disk area from l=+10º to +20º, with b=-4.5º to +4.5º
IV. Blue: High/Low disk: extending the southern disk area from |b|=-2.28º to 4.5º. This will connect the VVV/VVVX area to the VISTA Hemisphere Survey, at least partially, given that VHS uses a RA/DEC alignment of the tiles, whereas VVV/VVVX is aligned along l,b. The longitude range for this area is l=230º to 350º. The combination of VVV/VVVX and the UKIDDS Galactic Plane survey will cover the entire galactic disk, over the full 360º longitude range!!!
V. Yellow: Disk+230: extend the inner galactic disk area (|b|<=2.28º) from l=295º to 230º.
The observations for areas II to V will include deep JHKs multi-color observations and multi-epoch observations in the Ks band, the exact number of epochs varying for the different area. Disk 230 will be observed in Ks 39 times (incl. the multi-color observation). Disk-low/high , Bulge-low/high, and Disk+20 will be observed 24 times in Ks, also incl. the multi-color observations.
Progress in observations
All observations scheduled for the original VVV survey have been completed in 2015.


Completeness at 27. 01 .2023
198.B-2004(A): 2318 of 2318 OBs: 100 %, or 202.6 of 202.6 h: 100 %
198.B-2004(B): 1779 of 1779 OBs: 100 %, or 212.1 of 212.1 h: 100 %
198.B-2004(C): 1910 of 1910 OBs: 100 %, or 199.6 of 199.6h: 100 %
198.B-2004(D): 1040 of 1040 OBs: 100 %, or 173.2 of 173.2h: 100 %
198.B-2004(E): 2374 of 2374 OBs: 100 %, or 200.0 of 200.0h: 100 %
198.B-2004(F): 180 of 180 OBs: 100 %, or 20.8 of 20.8h: 100 %
198.B-2004(G): 4658 of 4658 OBs: 100 %, or 420.1 of 420.1h: 100 %
198.B-2004(I): 3323 of 3323 OBs: 100%, or 256.9 of 256.9h: 100%
198.B-2004(J): 46 of 46 OBs: 100 %, or 9.4 of 9.4h: 100 %
198.B-2004(K): 3580 of 3580 OBs: 100%, or 272.7 of 272.7h: 100%
198.B-2004(L): 216 of 216 OBs: 100 %, or 21.9 of 21.9h: 100 %
198.B-2004(M): 97 of 97 OBs: 100 %, or 15.8 of 15.8 h: 100 %
198.B-2004(N): 880 of 880 OBs: 100%, or 67.1 of 67.1h: 100%
198.B-2004(O): 850 of 850 OBs: 100 %, or 64.8 of 64.8h: 100 %
198.B-2004(P): 2982 of 2982 OBs: 100%, or 233.1 of 233.1h: 100%
As of 27.01.2023 all runs are complete.


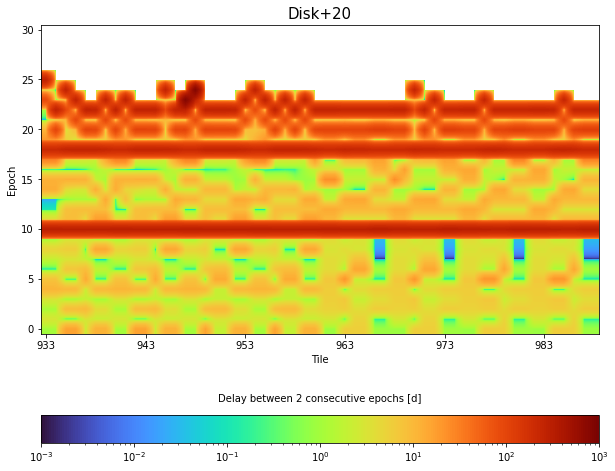
Distribution of Ks-band epochs
The following plots show the delay between two consecutive observing periods for each of the tiles in the different areas.
Bulge-ori

Disk-ori

Bulge-low/high

Disk+20
Disk-low

Disk-high

Disk+230

If you need any of the above plots, please send a request to maren551@gmail.com, the jpg files have a reduced resolution, and I can send you the original ps files.
